
Each platform reports in its own way
Platforms count conversions differently, so the same lead can appear twice and the totals never quite match.
See which channel, market and campaign carries your return, with Google Analytics, Search Console and your ad platforms side by side and every figure named and dated.
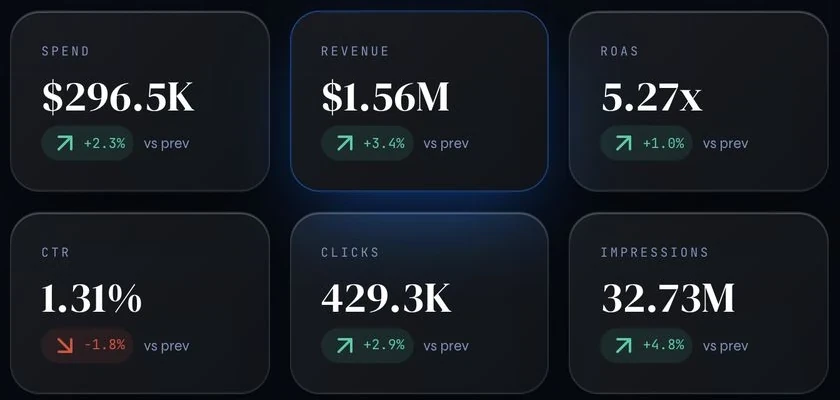
















Platforms count conversions differently, so the same lead can appear twice and the totals never quite match.
Logins, exports and spreadsheets take time before any decision, and the report is out of date once it is stitched together.
Traffic you pay to attract comes and goes, with no audience you own to market to afterwards.
The channel, market and campaign carrying your return stand out, because Analytics, Search Console and up to five ad platforms line up side by side in one view.
You can show the room where each number came from, because every figure names its source and date. Anything unmeasured says so, and with Analytics connected each visit is counted once.
Leverage the visits you already attract, because one site tag captures them as visitors browse. An email turns a visitor into one profile, and any segment exports as a CSV.
See your seven sources in one view.
See VIMDRIVE in actionAnalytics, Search Console and your ad accounts connect to your own workspace. Connecting reads without changing anything, and earlier history comes in too.
A funnel, a channel leaderboard and a market heatmap show where results stall, with call-outs on where to look first, on live data refreshed daily.
The picture can carry straight into campaign planning, so each cycle starts from what the last showed. Segments export as a CSV for your email, CRM or ad tools.
| Topic | Traditional agency model | With VIMDRIVE |
|---|---|---|
| Sources | Figures pulled from separate platform reports and spreadsheets | Seven sources side by side in one view, each named and dated |
| Counting | Each platform reports its own totals for the same result | With Analytics connected, each visit and lead is counted once |
| Reporting | A periodic report, written after the period closes | Live data refreshed daily, and campaigns built here flagged on the next daily read |
| Audience | Audience data often stays inside the tools that collected it | One site tag builds a first-party audience that exports as a CSV |
| Proof | Impact often read from credited results alone | A built-in holdout shows what each pop-up added |
It places Google Analytics beside Search Console and up to five ad platforms in one view. One set of numbers replaces seven logins, and funnel leaks and the strongest channel stand out. With Analytics connected, each visit and conversion is counted once.
Yes, because every source is named and dated. A strip on the dashboard shows each source, how far its data reaches and when it last refreshed. Incrementality reads 'not measured' until a holdout test or media-mix study provides it, so gaps are stated, never filled.
On the next daily read, not at month end. Each campaign built here is checked against its plan every day. Two days without delivery raises a critical alert, and pace is judged once a campaign has run seven days, so you can act while budget is unspent.
No, there is nothing to build first. Your workspace keeps your data apart from other clients' and reads your Analytics, Search Console and ad accounts. On first connection it reads 395 days of Analytics and 470 days of Search Console history, so you benefit from a trend from day one.
Watch your channels line up side by side, every figure named and dated, with the audience your visits already earn starting to take shape.