
Strength is hard to compare over time
Without a steady scale, each report uses different measures, so you cannot tell whether the brand is gaining or losing ground.
See where your brand stands, how it has moved and why, with weekly scores on one fixed yardstick and the evidence behind each one a click away.
















Without a steady scale, each report uses different measures, so you cannot tell whether the brand is gaining or losing ground.
A single number looks precise even when the evidence is thin, so it is hard to know how much weight it deserves.
Media and content decisions are made without seeing which parts of the brand are weakest or how rivals show up in AI answers.
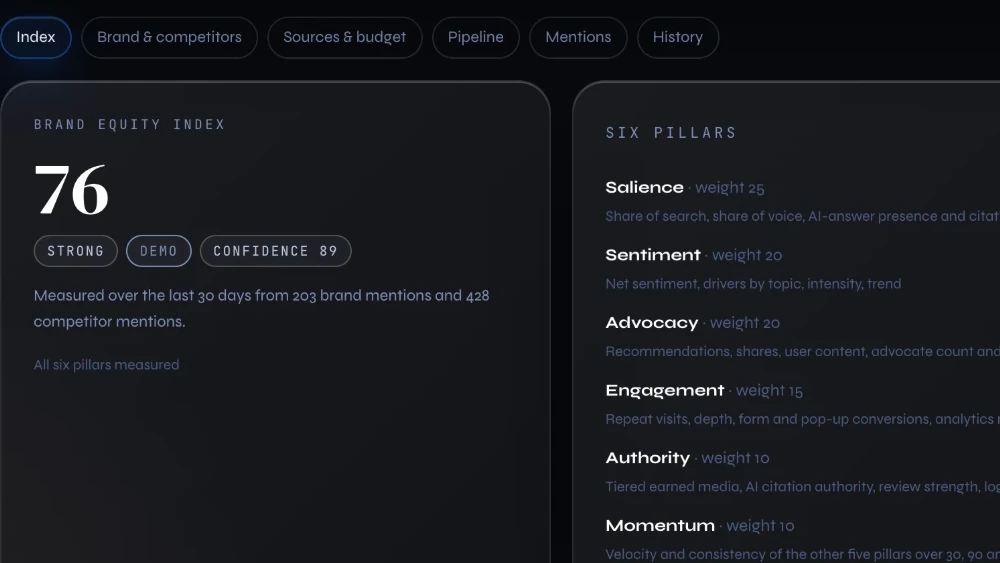
Brand movement means something, because fixed weights score every brand the same way. Six pillars, from Salience to Momentum, place your brand in one of five bands, from Weak to Exceptional.
You know how far to trust each score, because it carries a confidence figure from 0 to 100. Thin evidence reads 'not measured' instead of a guess.
Your weakest pillars, and how often AI answers name you against rivals you pick, show where media and content can go to work. Four AI answer engines feed that comparison.
See your brand's strength on one fixed yardstick.
See VIMDRIVE in actionAliases, products, handles, hashtags and exclusions set the edges of your brand, so namesakes and noise stay out of the score.
Pick up to five competitors, and each snapshot shows how often Claude, ChatGPT, Perplexity and Google AI name you against them.
Weekly snapshots leverage your first-party site data and AI answers, with no fieldwork, and after four snapshots Momentum shows your direction over 30, 90 and 365 days.
| Topic | Traditional agency model | With VIMDRIVE |
|---|---|---|
| Measuring strength | Brand health read through studies and reports | Six pillars with fixed weights, scored weekly on one steady yardstick |
| Confidence | Findings presented as headline scores | Every score states its confidence, and thin evidence reads 'not measured' |
| Evidence | Findings summarised in a deck or report | Every score opens to the evidence behind it |
| Competitors | Rival comparisons set up as separate projects | Up to five named rivals compared on how often AI answers name you |
| Trend | Each report framed around the brief it covers | Weekly snapshots carry their methodology version, so history stays like for like |
As far as its confidence figure says. Every index carries a figure from 0 to 100, built from seven inputs. Below 40 no index is shown, and below 60 it is labelled provisional. Where a pillar lacks evidence, it reads 'not measured' instead of a guess.
No. The index incorporates what AI answer engines say about your brand and how visitors behave on your site, so there is no fieldwork to run. Engagement scores once your site has 20 sessions. Keep any awareness or purchase-intent study you run, because the index does not measure those.
Yes, on Salience. You can name up to five competitors, and each snapshot shows how often AI answer engines name you against them. Rivals frame the comparison, and your brand alone is scored. Changing the set starts a separate series, so trends stay like for like.
Yes. Each workspace stands alone, so your data never mixes with another client's. You benefit from a score built on your own brand profile and your own site data, and every snapshot records its methodology version.
See the index on your own brand, or talk it through on a free strategy call.