
Every platform tells its own story
Each dashboard counts conversions its own way, so the same lead can appear twice, or not at all.
See which channels, campaigns and markets earn your budget in one view across seven sources, with every figure named and dated, so your next decision rests on evidence.
















Each dashboard counts conversions its own way, so the same lead can appear twice, or not at all.
Stitching exports into one spreadsheet is slow work, and by the time it is finished the figures have already moved on.
A stalled campaign can go unnoticed until the summary arrives, and the budget keeps moving in the meantime.
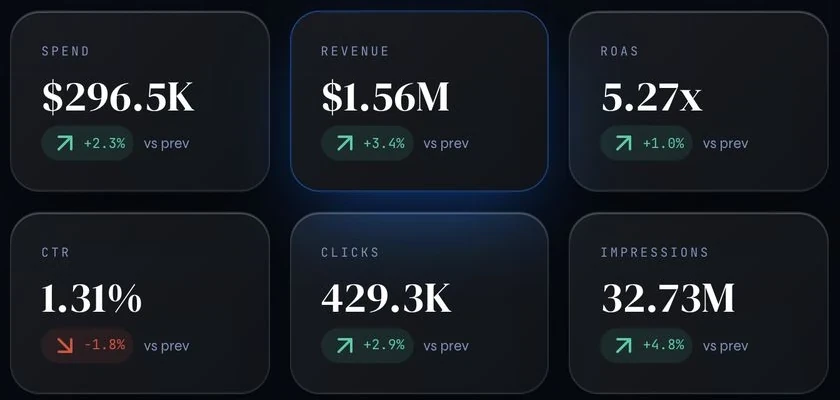
You can place budget where results are building, because spend and return line up channel by channel and campaign by campaign, with nine KPI tiles each set against the last period.
You can defend every number, because a strip names each of the seven sources and when it last refreshed, and anything unmeasured says so plainly.
Drift reaches you early, because campaigns built in VIMDRIVE are read against plan each day, so a stall or slow pace is flagged on the next daily read.
Ready to see your seven sources in one view?
See VIMDRIVE in actionAnalytics, Search Console and your ad accounts connect. The first connection incorporates 395 days of Analytics and 470 of Search Console, and the sync reads without changing anything.
Filter by channel, market or campaign and the view answers it. With Analytics connected, each visit and lead counts once.
Call-outs say where to look first, including spend with no conversion, and the funnel, channel leaderboard and market heatmap show where results stall.
| Topic | Traditional agency model | With VIMDRIVE |
|---|---|---|
| Sources | Figures gathered from several platforms and joined into one report | Seven sources read into one view, each named and dated |
| Reporting | Reports follow a set rhythm for each reporting period | Live data, refreshed daily, filtered by channel, market or campaign |
| Early warnings | Accounts are checked at set points in the reporting cycle | Campaigns built here are read against plan, with drift flagged on the next daily read |
| Traceability | Headline figures are shared in a summary | Every figure names its source and when it last refreshed |
| Next plan | Planning follows a separate brief for each cycle | The picture can carry straight into campaign planning |
Because each platform counts in its own way. VIMDRIVE leverages the accounts you already run and reads Google Analytics, Search Console, Google Ads, Meta, LinkedIn, TikTok and ChatGPT Ads side by side. A strip names each source and when it last refreshed, so every figure shows where it came from.
On the next daily read, once the day's data has landed. Campaigns VIMDRIVE builds from your plan are judged against it. A campaign with no delivery after two days live raises a critical alert, and pace is judged over seven days. Each problem raises one alert, which clears when the condition ends. Alerts appear inside the platform.
Yes. Where no revenue is tracked, the tiles switch to engaged sessions, cost per conversion and cost per click, the funnel drops its revenue stage and the heatmap shows visits by market, so you benefit from a view that measures enquiries, not sales.
No. The sync reads and changes nothing, so your campaigns, budgets and settings stay as they are. Your accounts stay yours, every action is on record, and a gap in the data is stated rather than filled, so you always know what the view does not cover.
Book a platform demo to see which channels, campaigns and markets earn your budget, across seven sources.